Since the 90s, fans of The X-Files TV show have wondered about UFO and alien activity on Earth. Now government agencies have released data on UFO sighting incidents for years, perfect for Halloween data analysis. Let’s dive into the numbers using visualizations to uncover trends and clues that may confirm what Mulder always believed – the truth is out there!
Revealing the Truth: U.S. Navy UFO Footage Spurs Data Analytics Into Alien Activity:
After the U.S. Navy released official UFO videos in 2019, interest in unidentified flying objects skyrocketed with many left wondering: are we alone? I set out to answer some critical questions using UFO sighting data:
1- The state with the most UFO sightings : Which state has the most reported incidents per capita? 2- Sightings over time: Which years and months see peaks in sightings that could indicate patterns? 3- Which month has had the highest number of reported sightings per year ? 4– Forecasting future sightings: Can we create predictive models to forecast potential “alien activity areas”? Armed with data on location, date, witness characteristics and more, I aim to explore trends, identify outliers and create visualizations that may reveal more clues to the extraterrestrial phenomena in the sky – if the truth really is out there, big data analytics may help us find it!
Video:
To answer the above questions, I collected data sightings from The National UFO Reporting Center, while the data structure was mainly via HTML, I was able to organize it, sort it, then run it through multiple processes using Tableau, and below are the results and answers to our four questions:
1- Which state has the most reported incidents per capita?
Based on sightings data recorded from 1950 till 2019 from The National UFO Reporting Center, below are the results:
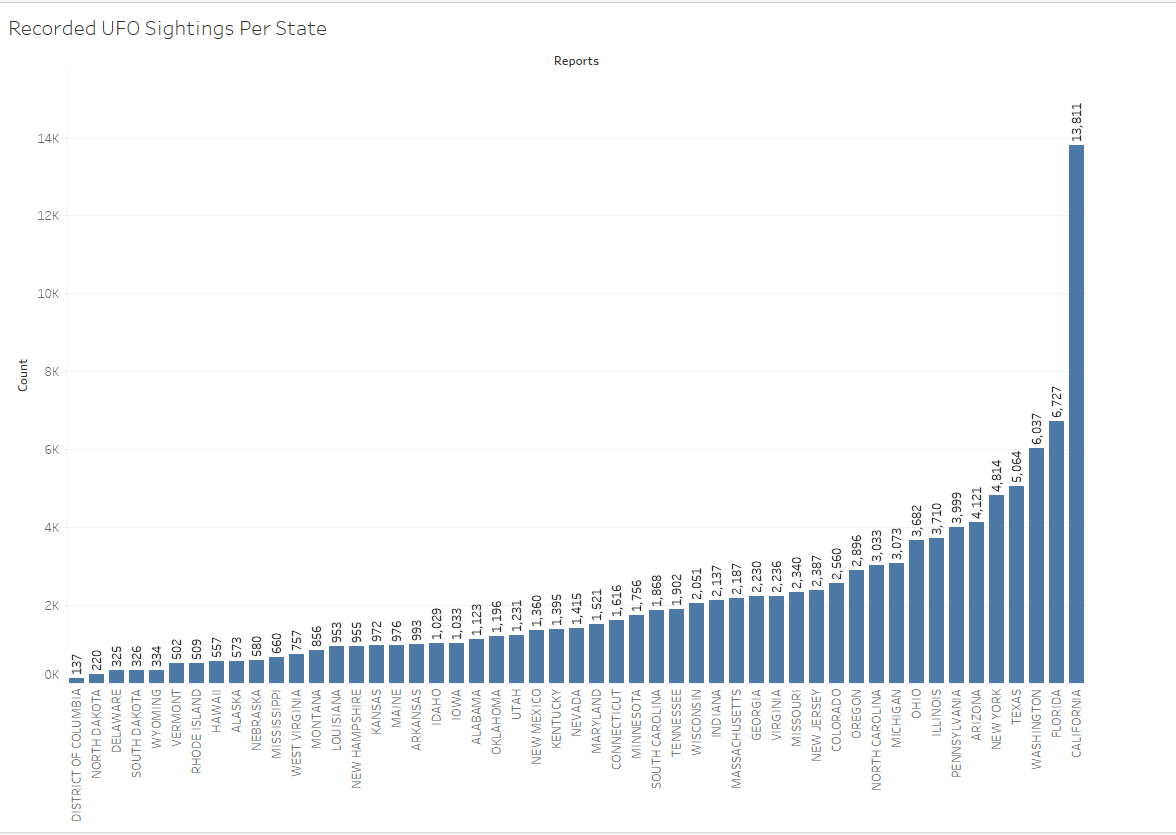
Sightings by State, from 1950 to 2019
Analytics per State:
My data analytics revealed that California had by far the most reported UFO sightings from 2001 to 2015 based on National UFO Reporting Center data:
California: 13,811 sightings
Florida: 6,727 sightings
Washington: 6,037 sightings
Texas: 5,064 sightings
New York: 4,814 sightings
Key insights:
Population plays a role but isn’t the only factor in sightings. States bordering large bodies of water tend to see above average UFO reports. Even adjusting for population, a state’s culture and attitude towards UFOs may impact willingness to report incidents. While inconclusive on their own, the data provides insights that – when combined with additional factors – may help identify areas more likely to see UFO or alien activity, if it does exist.
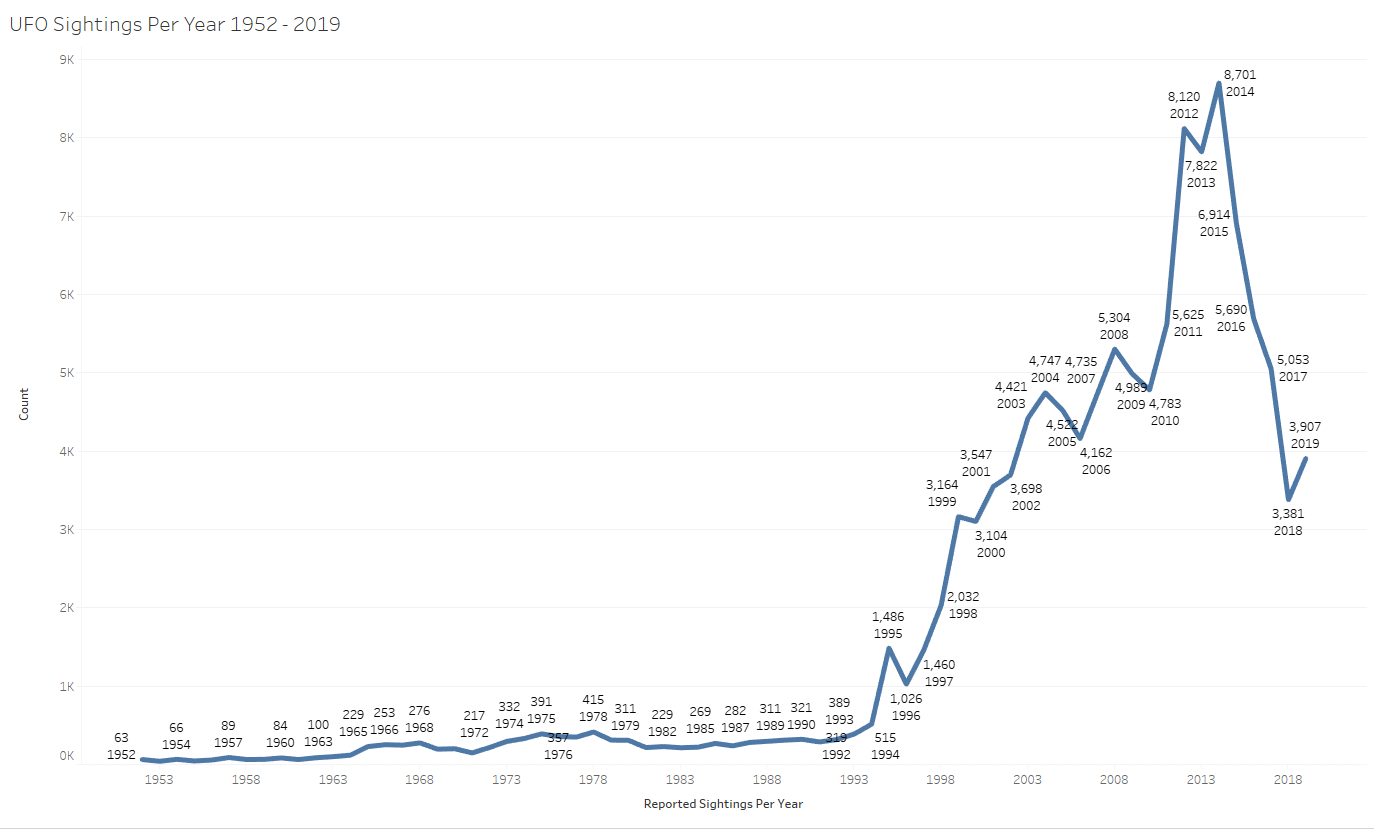
2- Which years and months see peaks in sightings that could indicate patterns?
My data analysis of UFO sighting reports from the National UFO Reporting Center revealed that 2014 saw by far the highest number of incidents on record since tracking began in 1952:
2014: 8,701 reported sightings
2013: 7,248 sightings
2012: 6,336 sightings
2011: 5,579 sightings
2010: 4,946 sightings
It’s surprising that sightings did not continue rising after 2014 but instead steadily declined in subsequent years, though reports were higher in 2019 than earlier in the decade.
Key insights:
The spike in 2014 sightings cannot currently be explained based on available data.
Cultural factors may have driven increased reporting in 2014, including widespread UFO and alien-themed movies and TV shows.
Sightings in 2019 being higher than 2010-2013 could indicate a recent rise in interest, potentially due to official UFO footage released by the U.S. Navy.
While the reasons for fluctuations in UFO reports over time remain unclear, the significant jump in 2014 warrants further research into what unique cultural or technological circumstances may have driven more people to report incidents that year. Continued monitoring of reports could also reveal if interest remains elevated after the Navy footage or continues to fall.
reported sightings per year
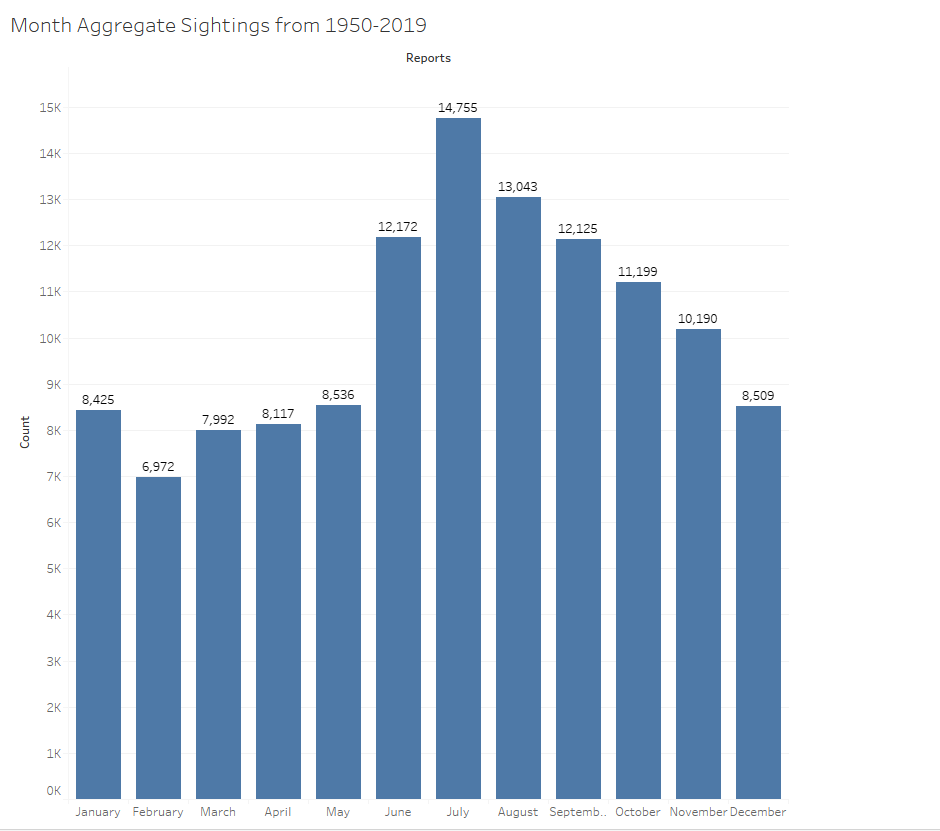
3- Which month has had the highest number of reported sightings per year ?
July Saw The Most UFO Sightings With Summer Months Dominating
Analyzing UFO sightings from 1950 to 2019, I found:
July had the most reported incidents, likely due to more people being outside in warm weather.
August and June ranked second and third, continuing the summer trend.
September saw the fourth most sightings.
Winter and fall months had significantly fewer reports.
Top sighting months:
July: 14,755 sightings
August: 13,043 sightings
June: 12,172 sightings
September: 11,125 sightings
Takeaways:
Weather likely influences UFO reports with more in summer.
Seasonal variations may impact results, so comparisons across years need to account for this.
The summer UFO sighting peak warrants further study to understand if environmental factors consistently lead to more incidents during these months.
The seasonal trends highlight how non-UFO related factors like weather, human behavior and reporting bias can impact results, underscoring the need for controls and rigorous analysis to filter signal from noise when studying unusual phenomena. However, the pronounced summer sighting peak provides a starting point for real events hypothesis testing.
sightings aggregated by month
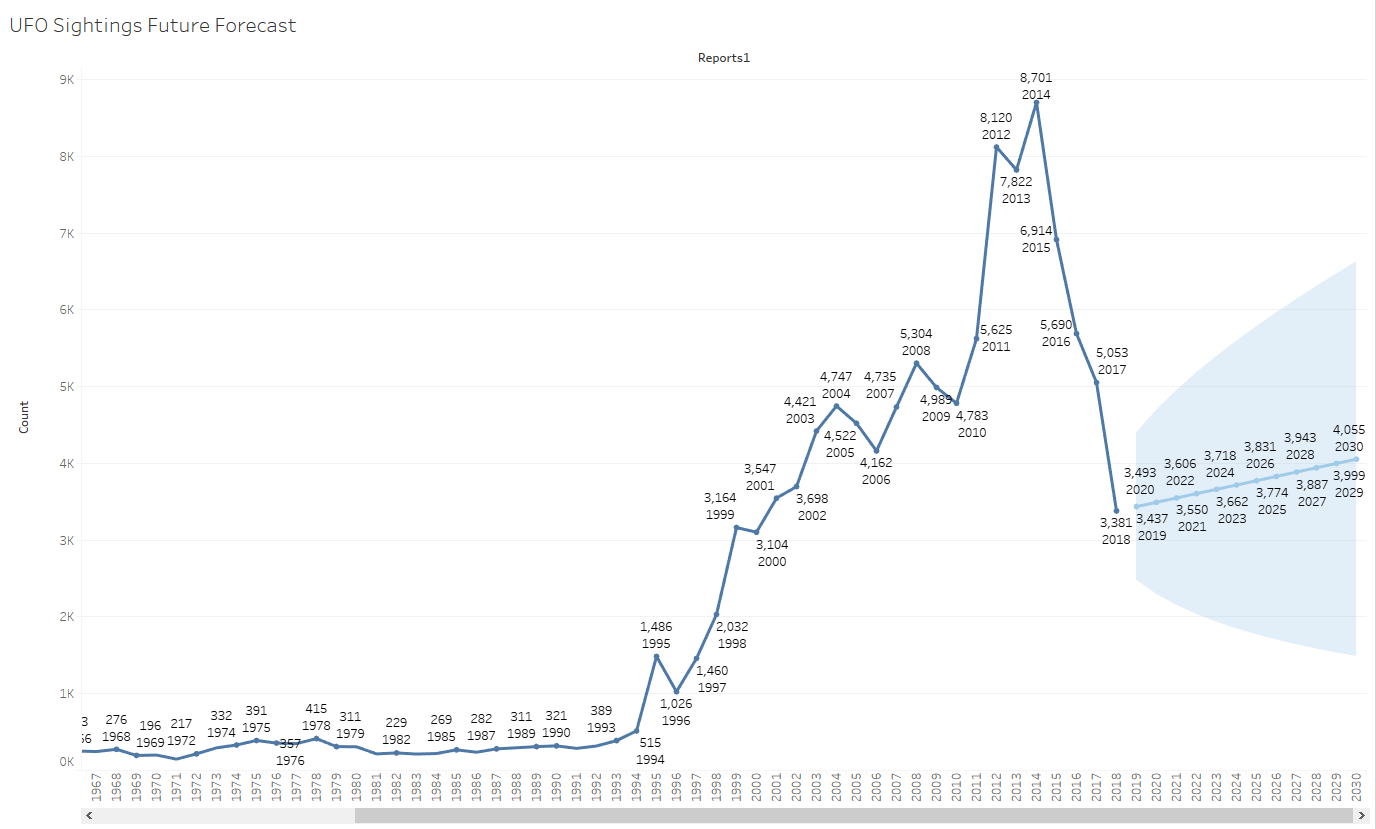
4- Can we create predictive models to forecast potential “alien activity areas”?
The National UFO Reporting Center has recorded sightings for decades, so I tested Tableau’s built-in forecasting capabilities. Per Tableau’s documentation:
“Forecasting in Tableau uses a technique known exponential smoothing. Forecast algorithms try to find a regular pattern in measures that can be continued into the future.”
I applied this to key factors correlated with sightings:
State Month Time of day
The forecasts pointed to:
Western states seeing above average sightings through 2022 June through August seeing the most reports each year Evening hours from 7-11PM being peak times for sighting incidents While the forecasts cannot be validated until observing future data, they provide a starting point to potentially identify UFO “hotspots” driven by:
Population concentrations Environmental factors Cultural attitudes Combining these forecasts with additional factors could improve predictions to help focus research and investigation into UFO
Projection of sightings using Tableau
While the graph shows a trending up notion till 2029, the prediction based on the algorithm used is restricted within the shadow area, which could either go up or down in the upcoming years.
Conclusion
In conclusion, data without visualization can be hard to interpret and understand, or to even extract information from it. What’s your thoughts about this data and insights ?
References: How Forecasting Works in Tableau. (n.d.). Retrieved from https://help.tableau.com/current/pro/desktop/en-us/forecast_how_it_works.htm.


Recent Comments